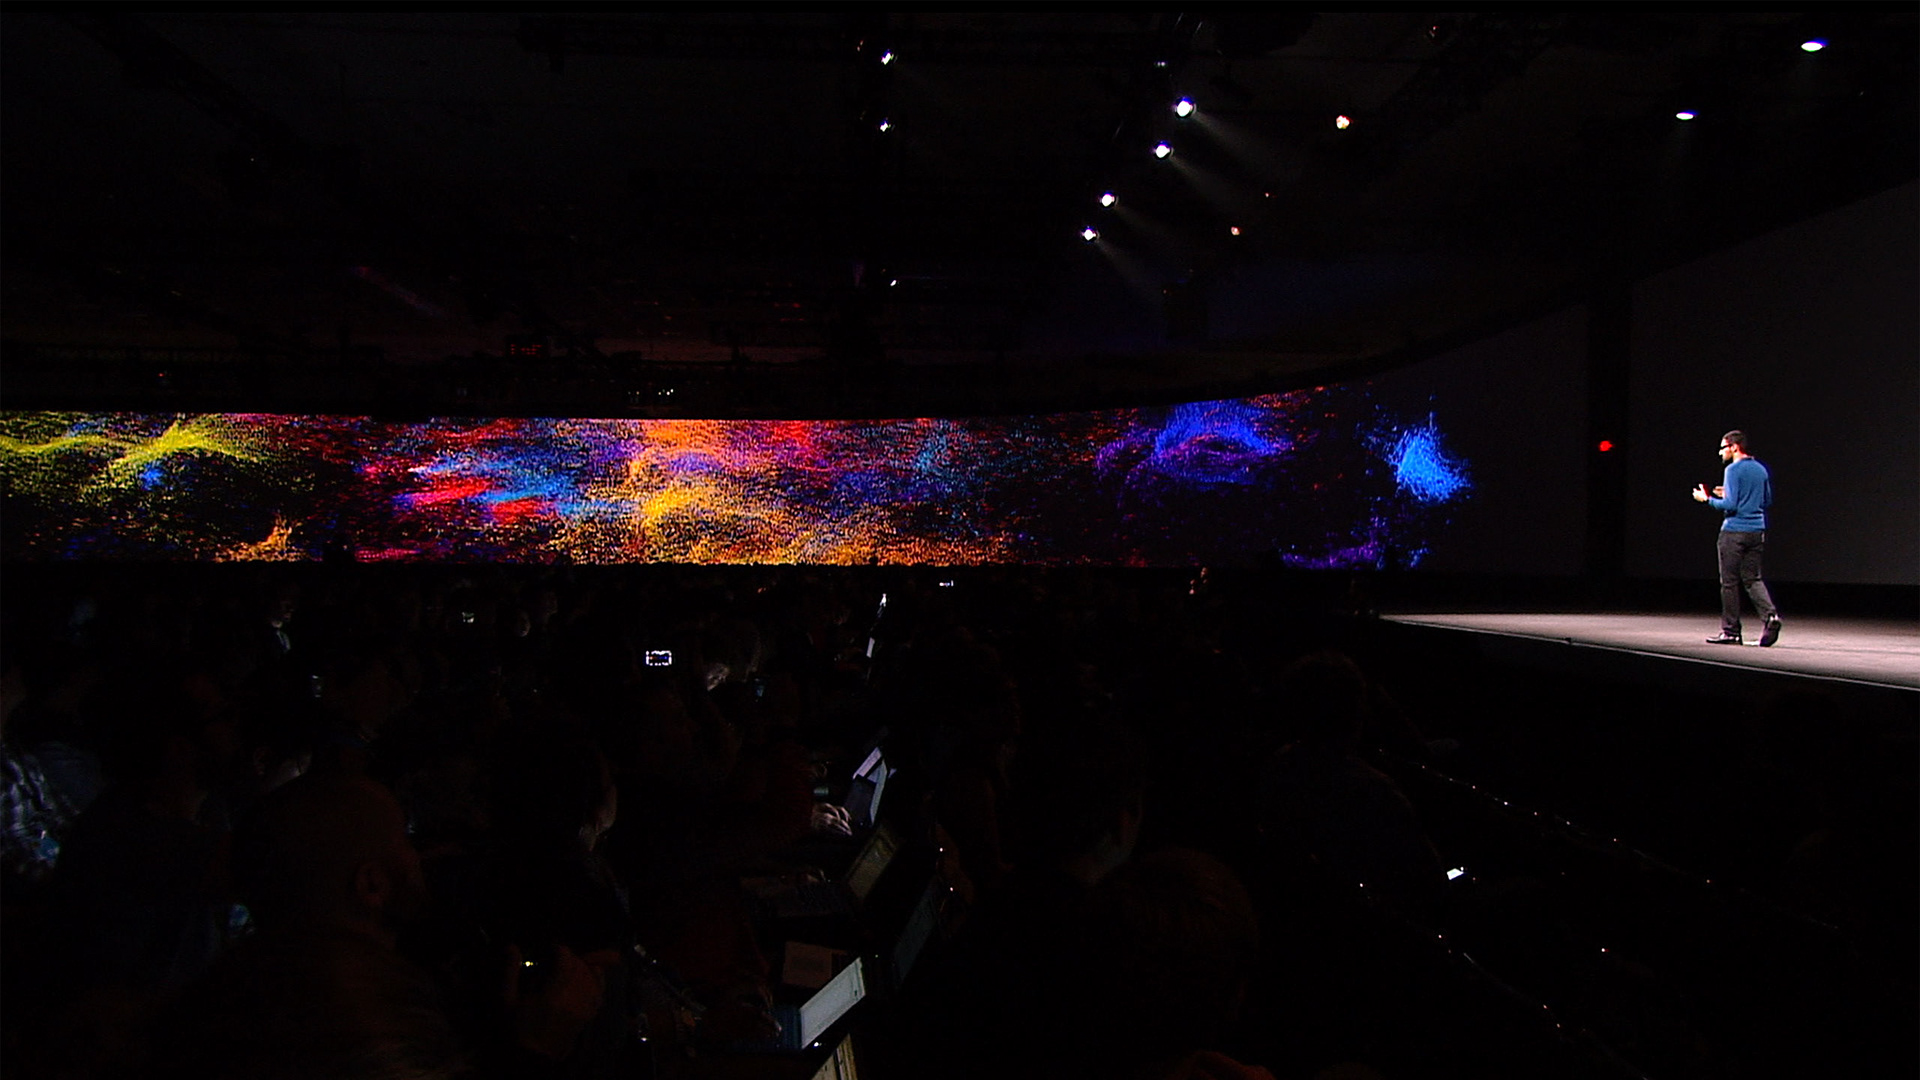
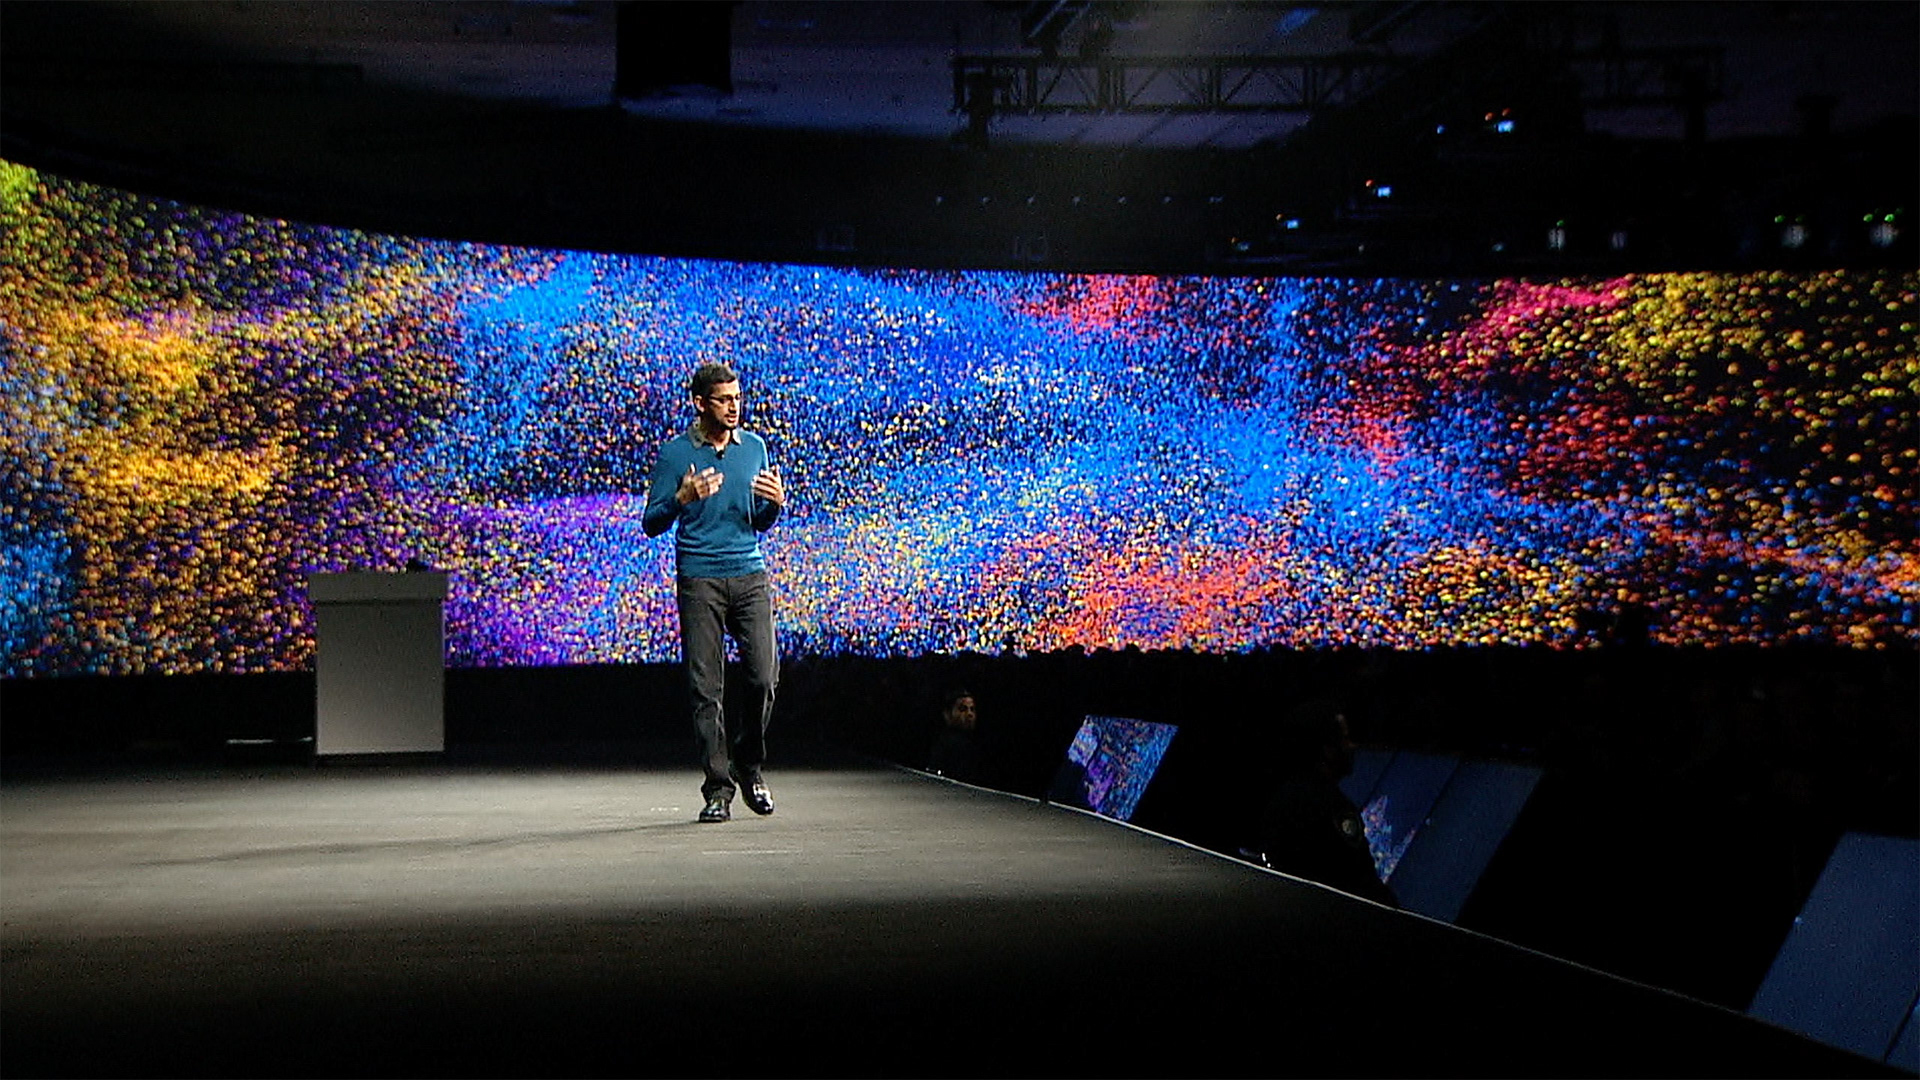
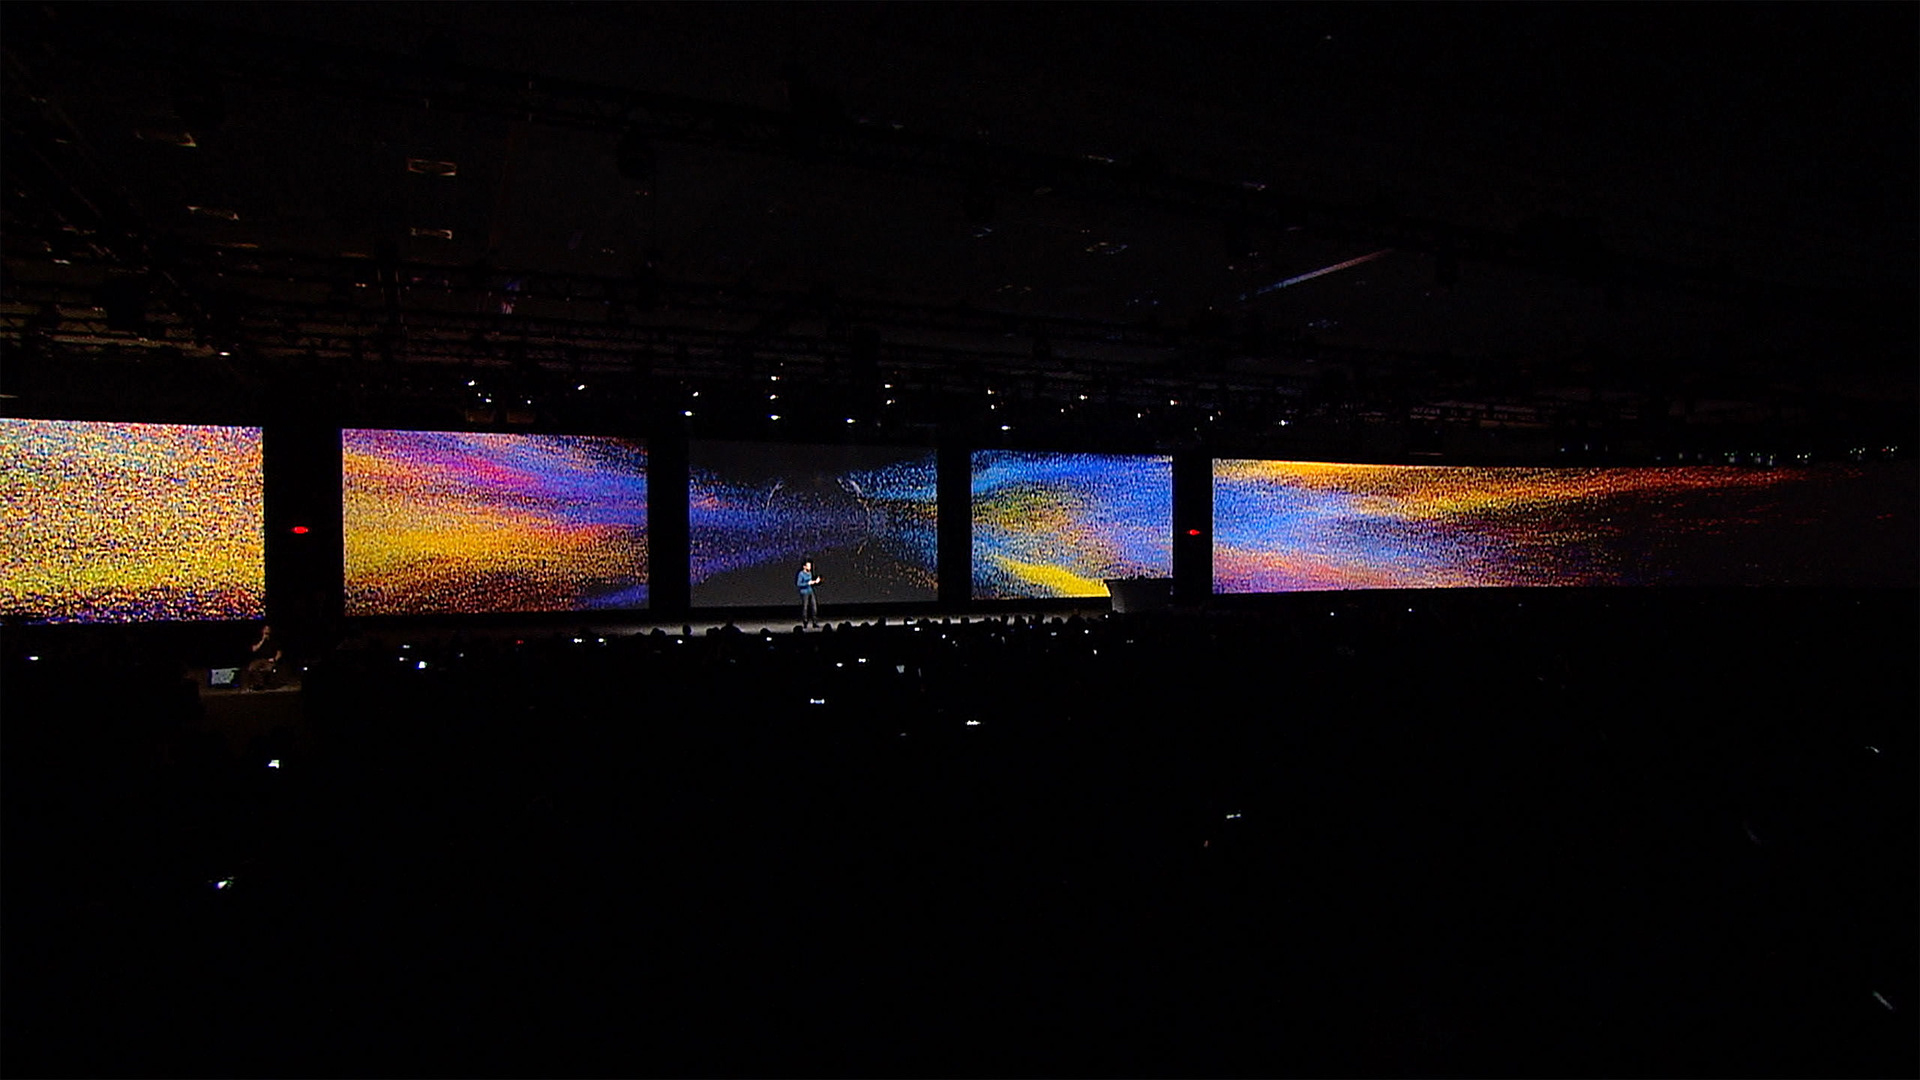
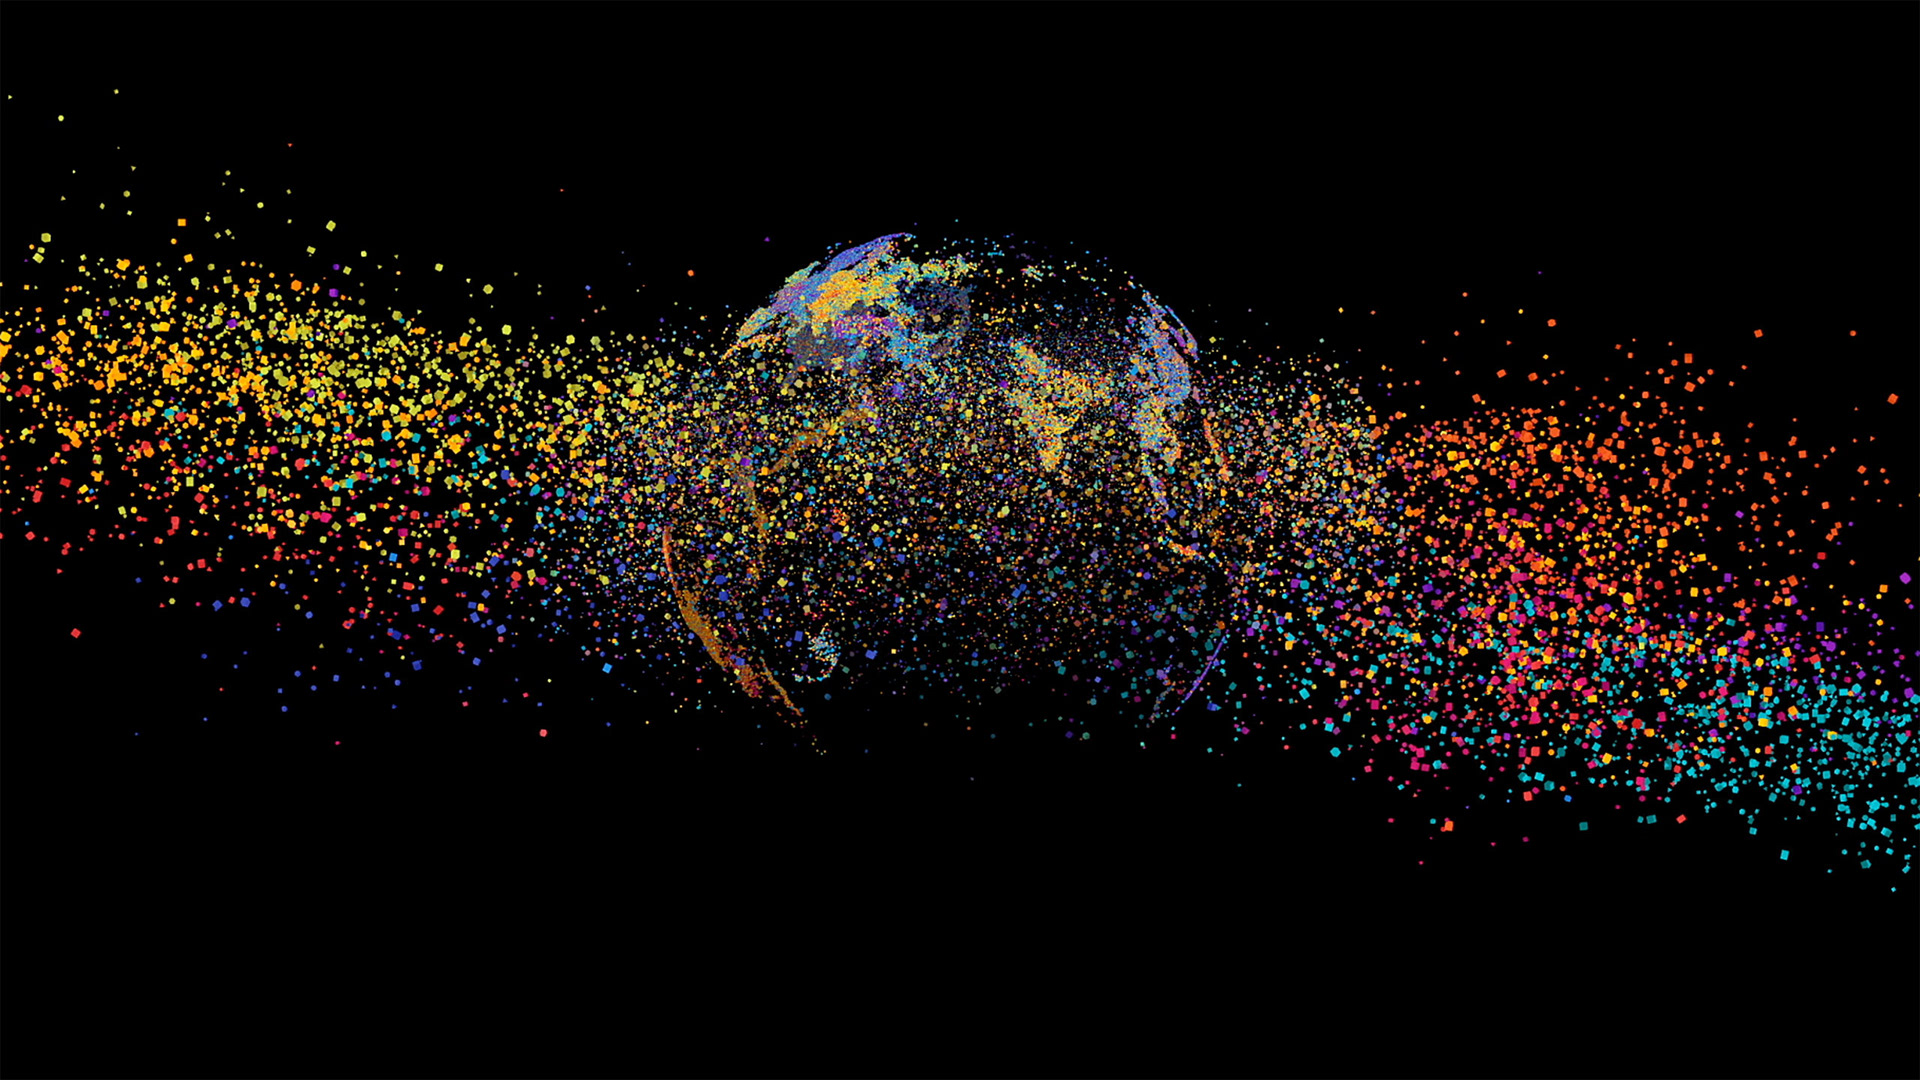
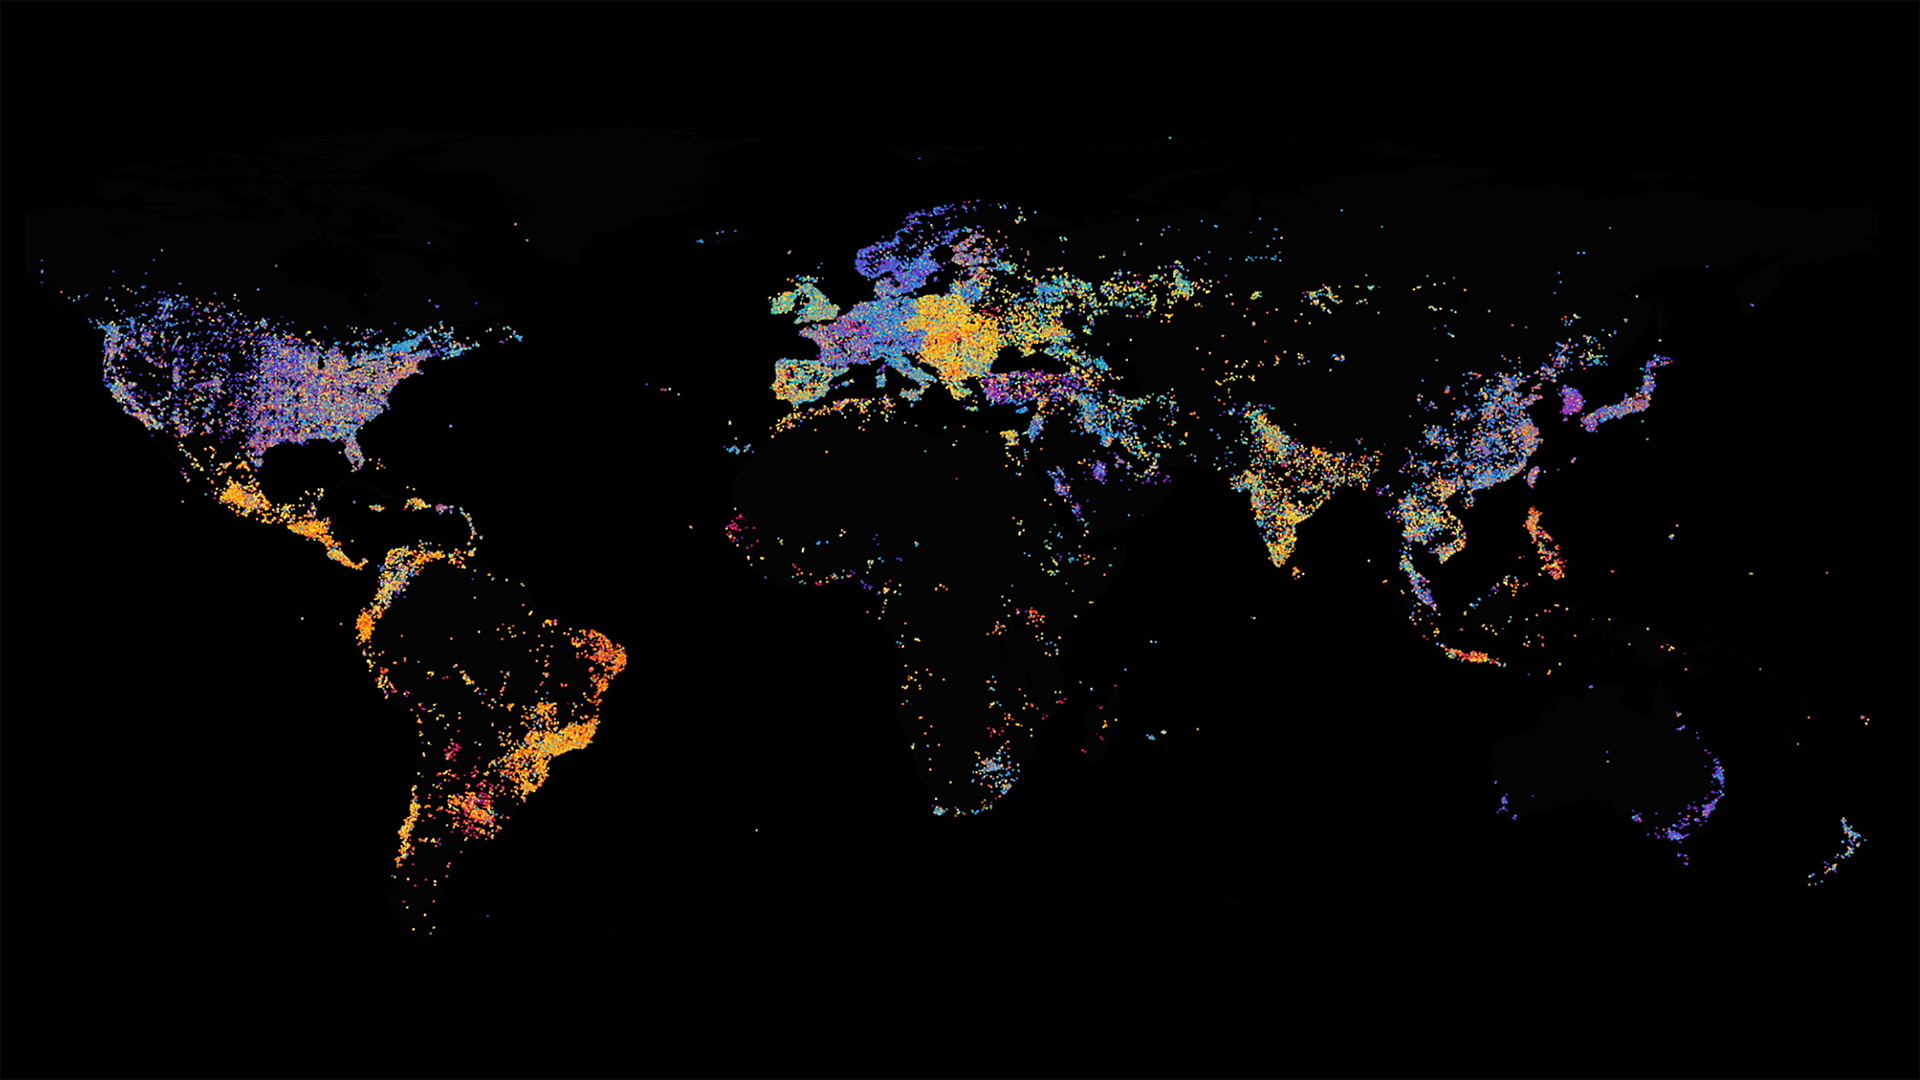
This is a data visualization that represents one billion active Android users and the variety of devices they use as of 2015. (colors represent the range of hardware specs). The visualization debuted on a 531 by 17 foot wrapped around screen at the opening keynote for the 2015 Google I/O conference. This project was created by the Data Arts Team at Google and Variable in UK.